Data visualization is an inherently digital practice, and it leaves our work feeling flat.

I began experimenting with crochet as a way to make maps that can be read with our hands as much as by our eyes. I started with point, line, and polygon vector features, but crochet is an excellent medium for raster data as well.
Each of my patterns begins with a geospatial dataset (or multiple datasets). I apply some generalization techniques to create a crochet pattern I’m happy with.

Each piece takes many hours of work. You can learn more about my process and why I do this by checking out one of my presentations below:
- How (and why) to incorporate texture into your data visualizations (Wisconsin Tableau User Group)
- Journalists are turning to crochet to tell data stories (Nieman Reports)
- Data visualization using fabric (Perpetual Notion Machine on WORT FM)
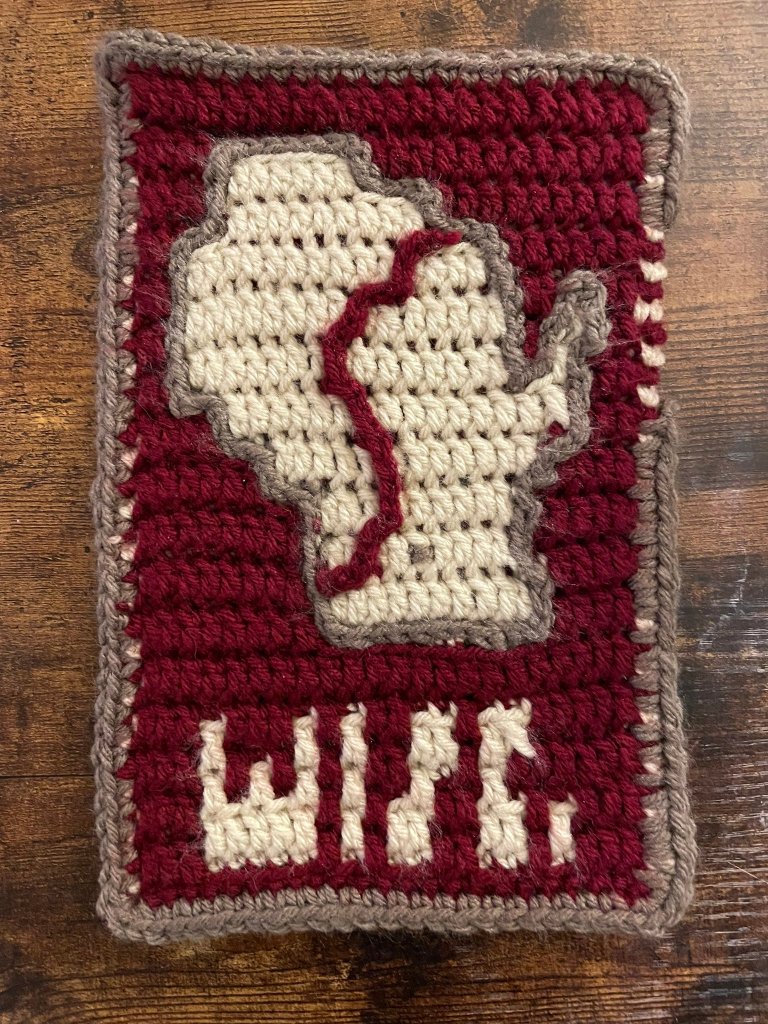
Completed: May 2023
Technologies used: QGIS / Crochet (interlocking layers, mosiac crochet)
